
Date Created : 11/30/2022 12:00:00 AM : Story Author : Shang Annang Papa Nii
The District League Table (DLT), since its inception in 2014 has served as one of the important tools for measuring the status of development at the subnational level. The tool is in pursuance of the National Development Planning Commission’s mandate of monitoring and evaluating development outcomes by highlighting inequalities and disparities in well-being across the country. It also provides a multi-sectoral, integrated assessment of how Ghana is developing across all its Metropolises, Municipalities, and Districts (MMDs), based on selected sectors and indicators.
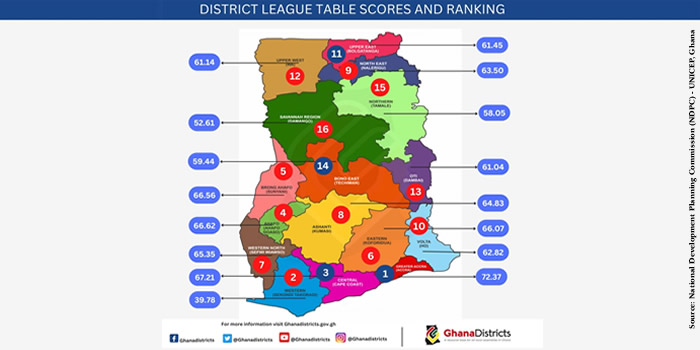
The infographic below presents the total score and ranking by region. Greater Accra Region recorded the highest score, maintaining its 2020 position, while Savannah Region attained the lowest score, making it the worst-performing region. North East Region improved from 16th position in 2020 to 9th position in 2021, while Savannah Region dropped from 15th position in 2020 to 16th position in 2021. This calls for further analysis on the causative factors for the drop in Savannah Region as well as lessons for the rise in performance in North East Region, given that they are all in the Northern part of the country.
Source: National Development Planning Commission (NDPC)- UNICEF, Ghana
 facebook
 X (twitter)
 Youtube
 +233 593 831 280
 0800 430 430
 GPS: GE-231-4383
 info@ghanadistricts.com
 Box GP1044, Accra, Ghana